

Open Control Tower
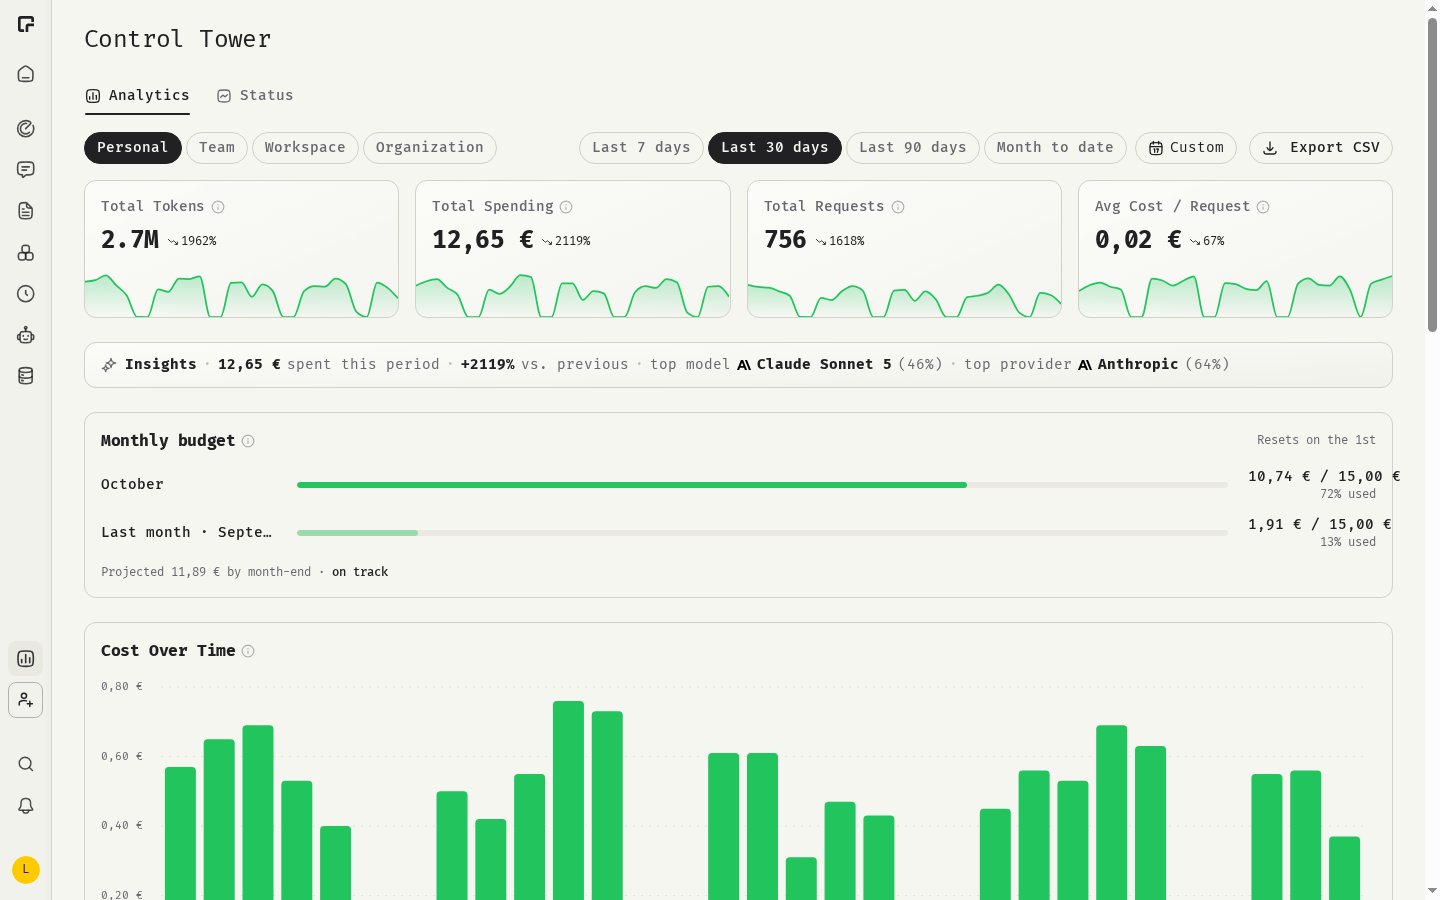
Click Control Tower in the sidebar. The page has two sections:- Analytics: usage and spend dashboards.
- Status: the current status of 48° and the AI providers it uses.
Control Tower needs a desktop-sized screen. On a phone, open it on your computer instead.
Choose a scope
The tabs at the top set whose usage you see.
On Team, Workspace and Organization, pick the team, workspace or organization in the selector next to the tabs. If the selector is missing, you don’t have the required role at that level. Ask an Owner to change your role, see Roles and permissions.
Pick a date range
Use the range buttons on the right:- Last 7 days
- Last 30 days (default)
- Last 90 days
- Month to date
- Custom: pick a start and end date in the calendar.
What the dashboard shows
Hover the info icon next to a section title for a short explanation.
In Usage by User, a member who can’t be matched to a name shows an ID. Click Resolve to look up their name and email. A member who has since left the organization shows Not found.
Export to CSV
Click Export CSV to download the usage for the current scope and date range. Use it for internal reporting or cost allocation.How current the data is
Usage figures are collected in the background. A request can take a few minutes to appear in Control Tower.Related
Spend and cost per model
Read the cost charts.
Usage limits
Limits that apply to your organization.
Roles and permissions
Who can see which scope.
Your usage
How members see their own usage.